innmind / profiler
App profiler
4.1.0
2024-03-10 16:39 UTC
Requires
- php: ~8.2
- innmind/framework: ~2.0
- innmind/html: ~6.2
- innmind/immutable: ~5.2
- innmind/json: ^1.3
- innmind/operating-system: ~4.1|~5.0
- innmind/url-template: ^3.0
- ramsey/uuid: ~4.7
Requires (Dev)
- innmind/black-box: ~5.5
- innmind/coding-standard: ~2.0
- vimeo/psalm: ~5.6
Provides
README
App profiler to help profile any kind of applications (http or cli).
This package can be integrated in an existing app (using innmind/framework) or run as a standalone app
Installation
composer require innmind/profiler
Overview
The profiler contains 2 types of entities: a profile and sections.
A profile contains a name (usually the http path called or the cli), the point in time the profile started, the status (succeeded, failed or pending) and an exit message.
A section is a part of a profile. By default there are 9 sections:
- Http: the request and response (if the app didn't crash) the app received
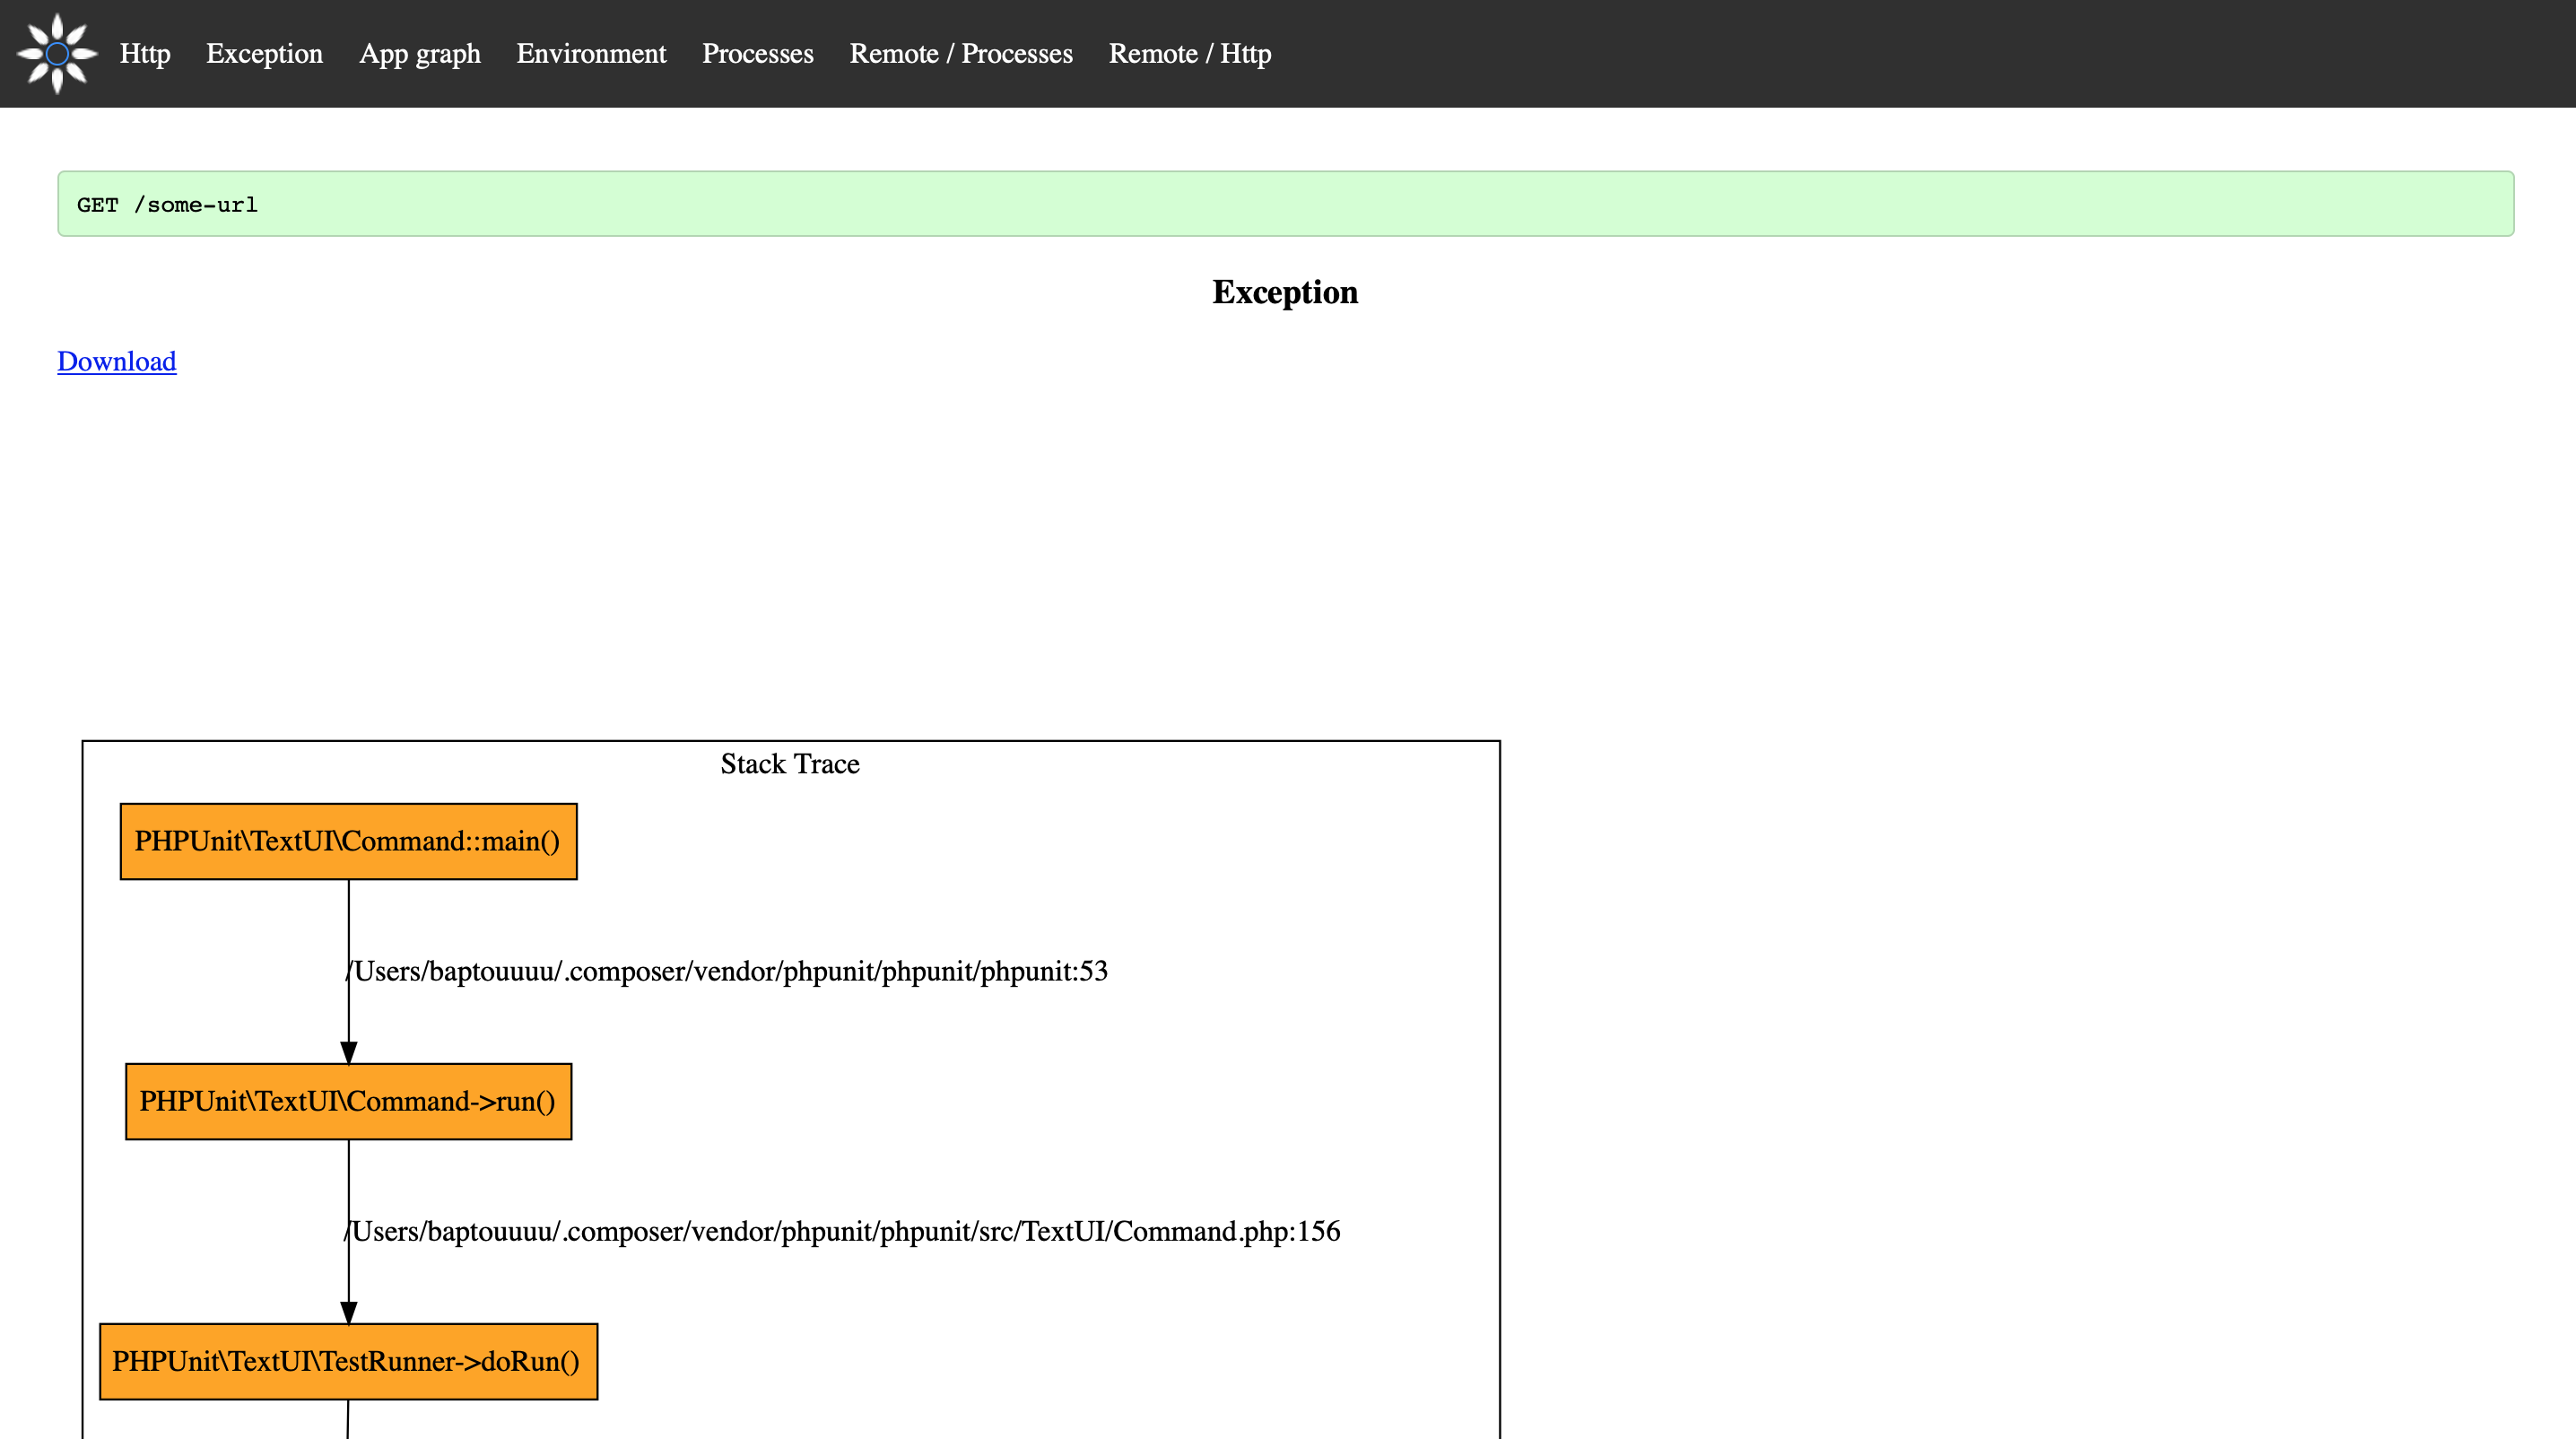
- Exception: the stack trace represented as graph (see
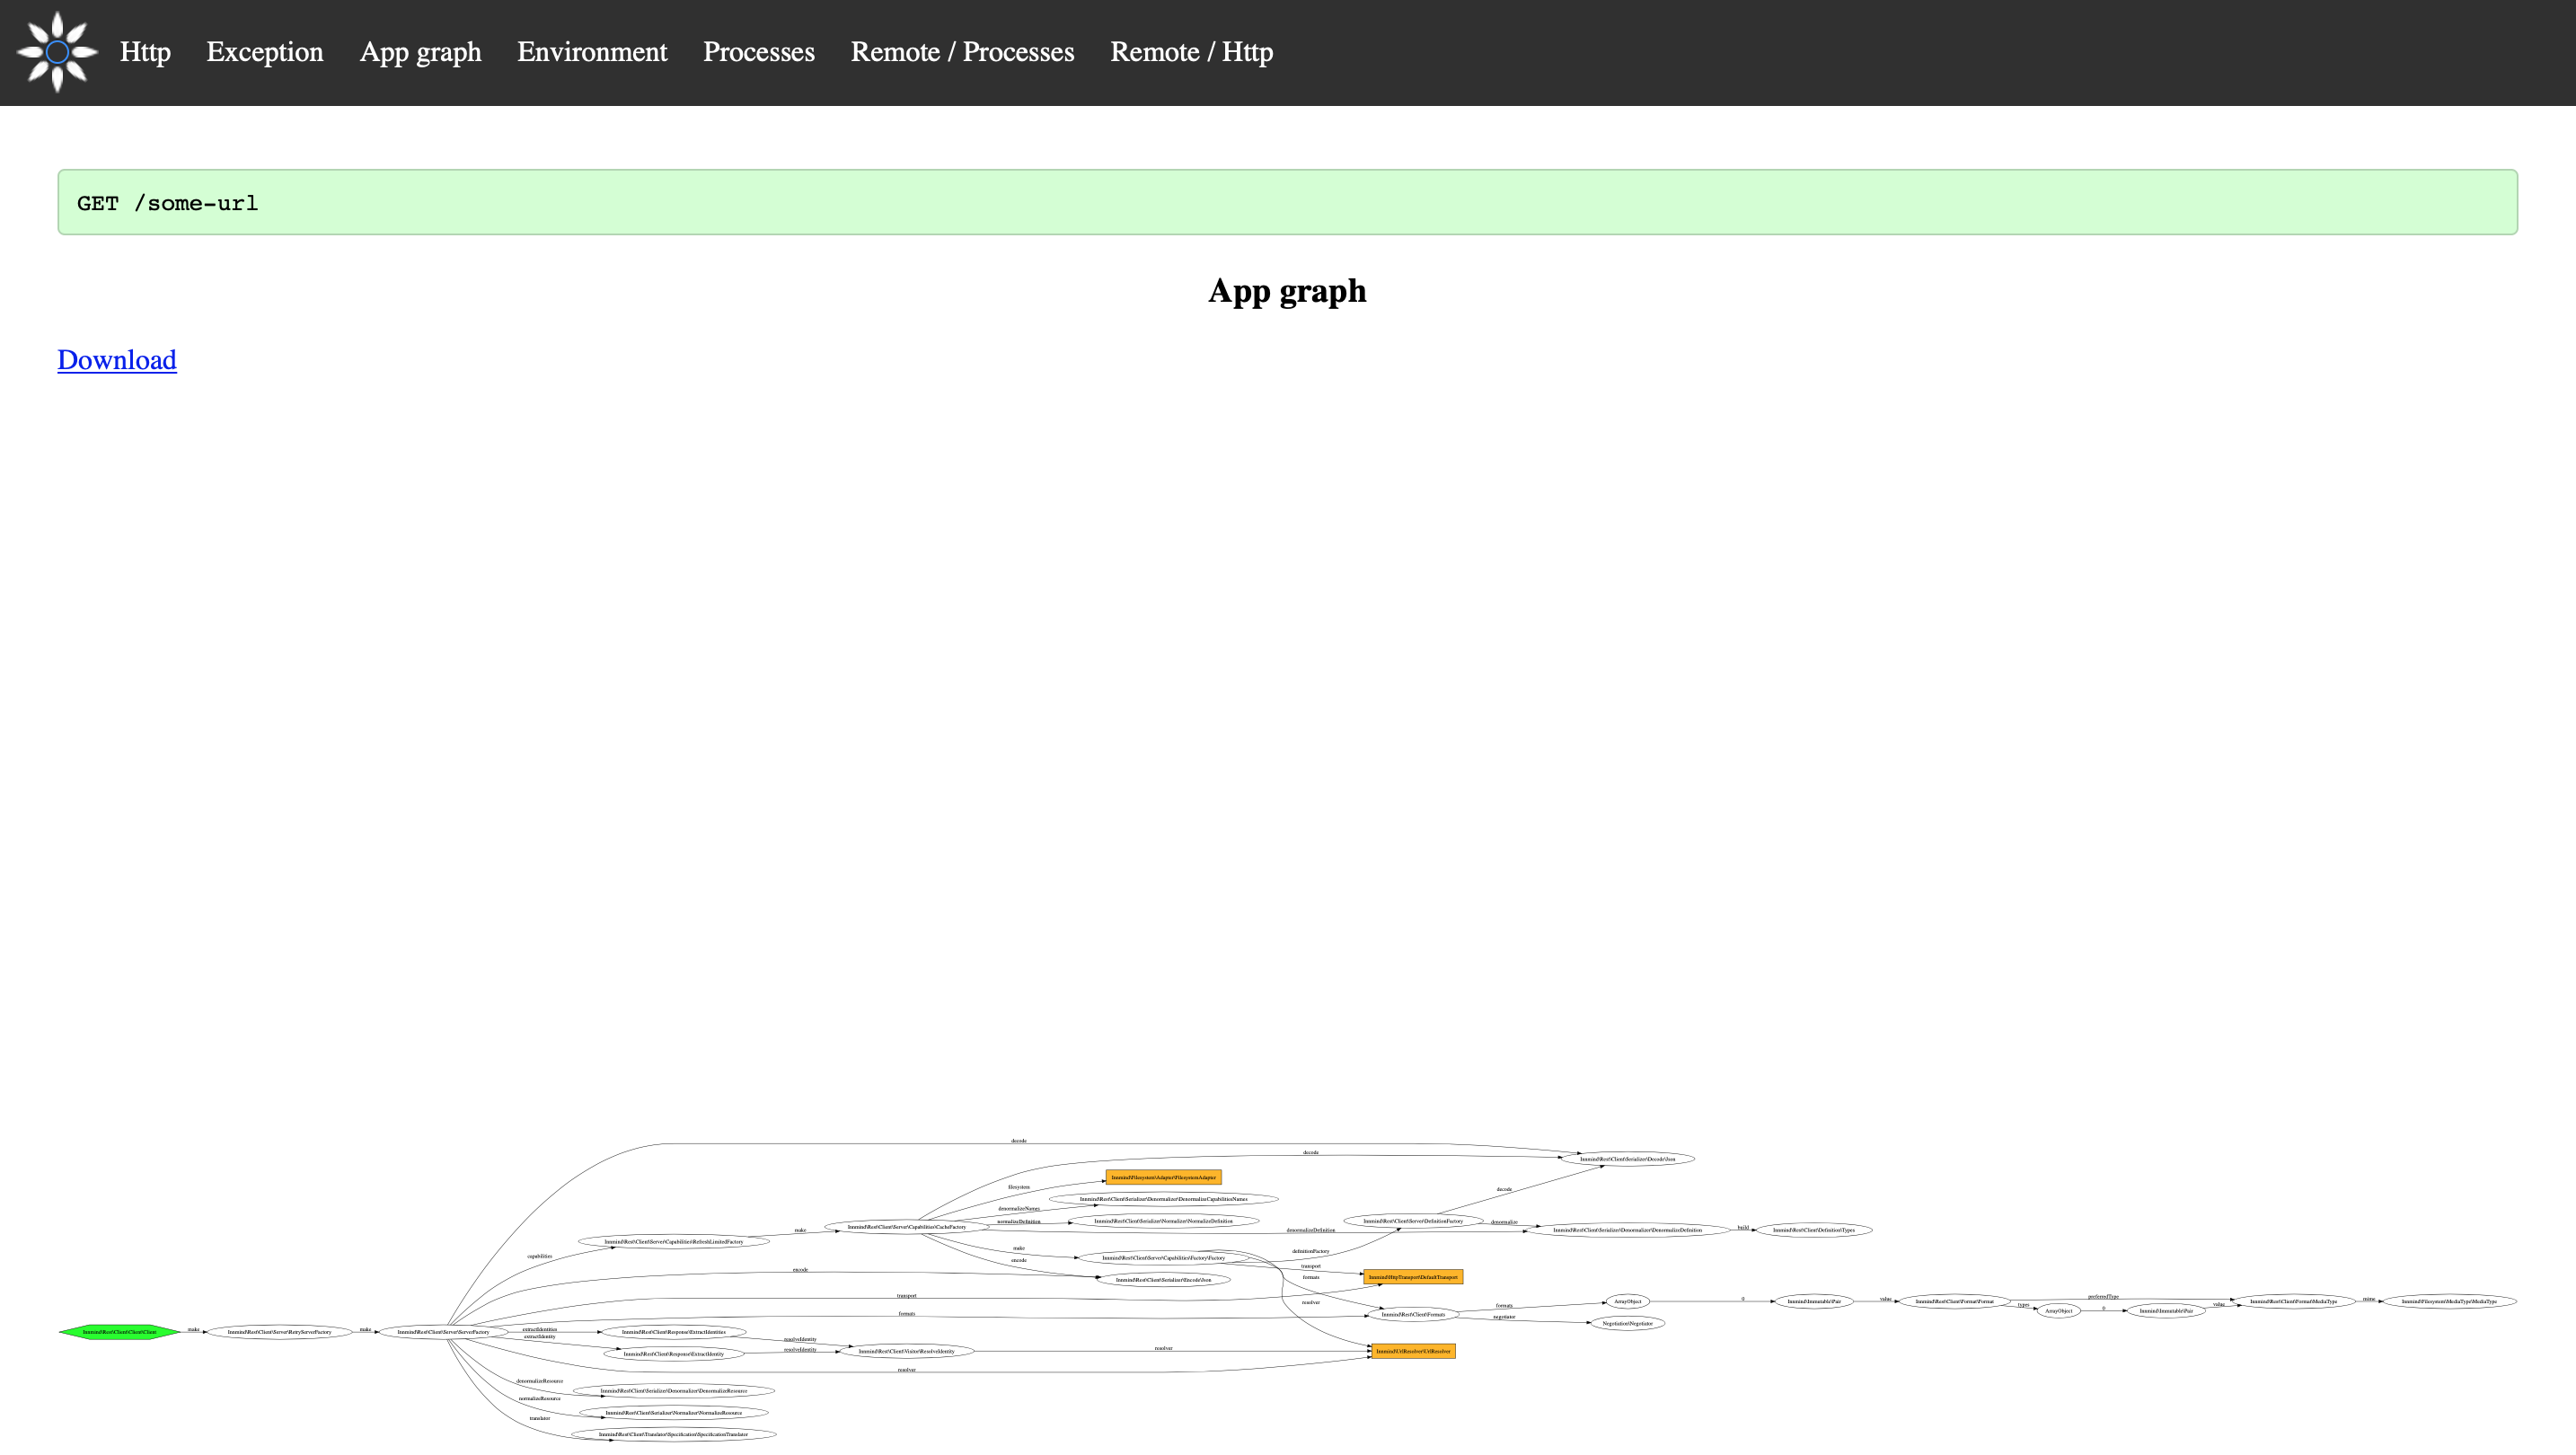
innmind/stack-trace) - App graph: the object graph representing the application (see
innmind/object-graph) - Call graph: a flamechart
- Environment: the list of environment variables
- Processes: the list of commands run on the machine
- Remote / Http: all the http requests issued by the application
- Remote / Processes: all the commands run on a distant machine
- Remote / Sql: all the SQL queries issued to a database
Documentation
All the documentation can be found in the docs folder.


