lekoala / silverstripe-debugbar
DebugBar for SilverStripe CMS
Installs: 200 256
Dependents: 4
Suggesters: 0
Security: 0
Stars: 56
Watchers: 7
Forks: 27
Open Issues: 0
Type:silverstripe-vendormodule
Requires
- php: ^8.1
- jdorn/sql-formatter: 1.3.x-dev
- maximebf/debugbar: ^1.18
- silverstripe/framework: ^5
- tractorcow/silverstripe-proxy-db: 2.0.0
Requires (Dev)
This package is auto-updated.
Last update: 2024-12-24 00:21:52 UTC
README
Installation
You can install the debug bar with Composer:
composer require --dev lekoala/silverstripe-debugbar
Documentation
- Introduction
- Execution timeline
- Database profiling
- System logs and messages
- Template use
- Partial caching hits and misses
- Environment and other information
- Helper methods
- Configuration options
- Troubleshooting
Introduction
SilverStripe Debug Bar is a wrapper for PHP DebugBar which integrates with SilverStripe to provide more useful information about your projects. The Debug Bar can help you to easily identify performance issues, analyse environment settings and discover which parts of your code are being used.
For example, if your application is running the same database query multiple times in a loop, or a certain controller action is taking a long time to run, Debug Bar will highlight these bottlenecks so you can take steps to improve your overall site performance.
This module will:
- Log framework execution based on available hooks
- Log and profile database calls
- Show all SilverStripe log entries
- Show all session, cookie, requirements, SiteConfig and request data
- Show current locale, framework/CMS version, current member
- Show request timing/profiling and memory consumption
The DebugBar is automatically injected into any HTML response through the DebugBarMiddleware, and will only run in "dev" mode.
Execution timeline
The execution timeline ("Timeline" tab) provides you with a graphical overview of each controller and action, listing how long it takes for each to complete.
The example above is from loading a page in the CMS.
You can also use our helper DebugBar::trackTime in order to start/stop a given measure. This will also work even before DebugBar is initialized
allowing you, for example, to measure boot up time like this:
DebugBar::trackTime('create_request');
$request = HTTPRequestBuilder::createFromEnvironment();
// This line is optional : you can close it or it will be closed automatically before pre_request
DebugBar::trackTime('create_request');
Speaking of boot time, you can get a more accurate measure than the one provided by $_SERVER['REQUEST_TIME_FLOAT'] by
defining the following constant in your index.php file.
require dirname(__DIR__) . '/vendor/autoload.php';
define('FRAMEWORK_BOOT_TIME', microtime(true));
This will give you a distinct php and framework boot time. This way, you can measure, for instance, the effects
of doing a composer dumpautoload -o on your project.
Note : any pending measure will be closed automatically before the pre_request measure.
Database profiling
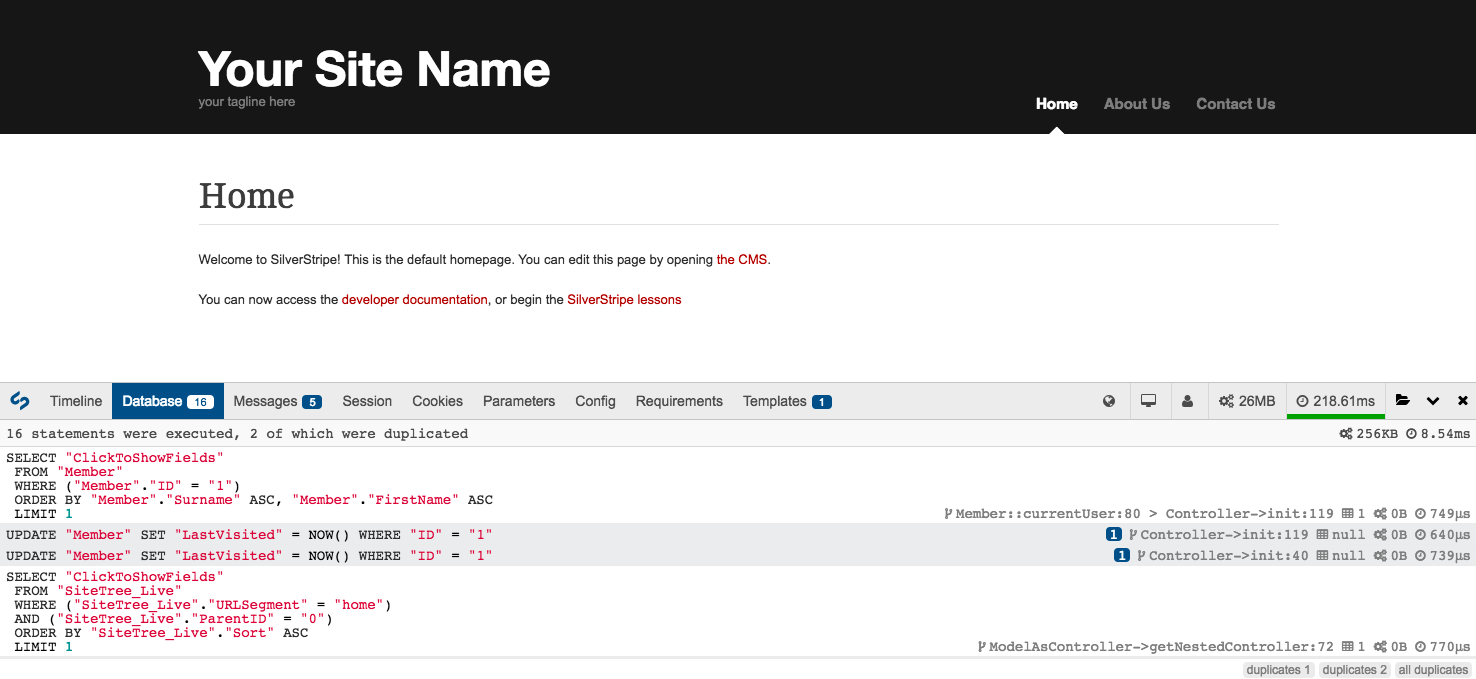
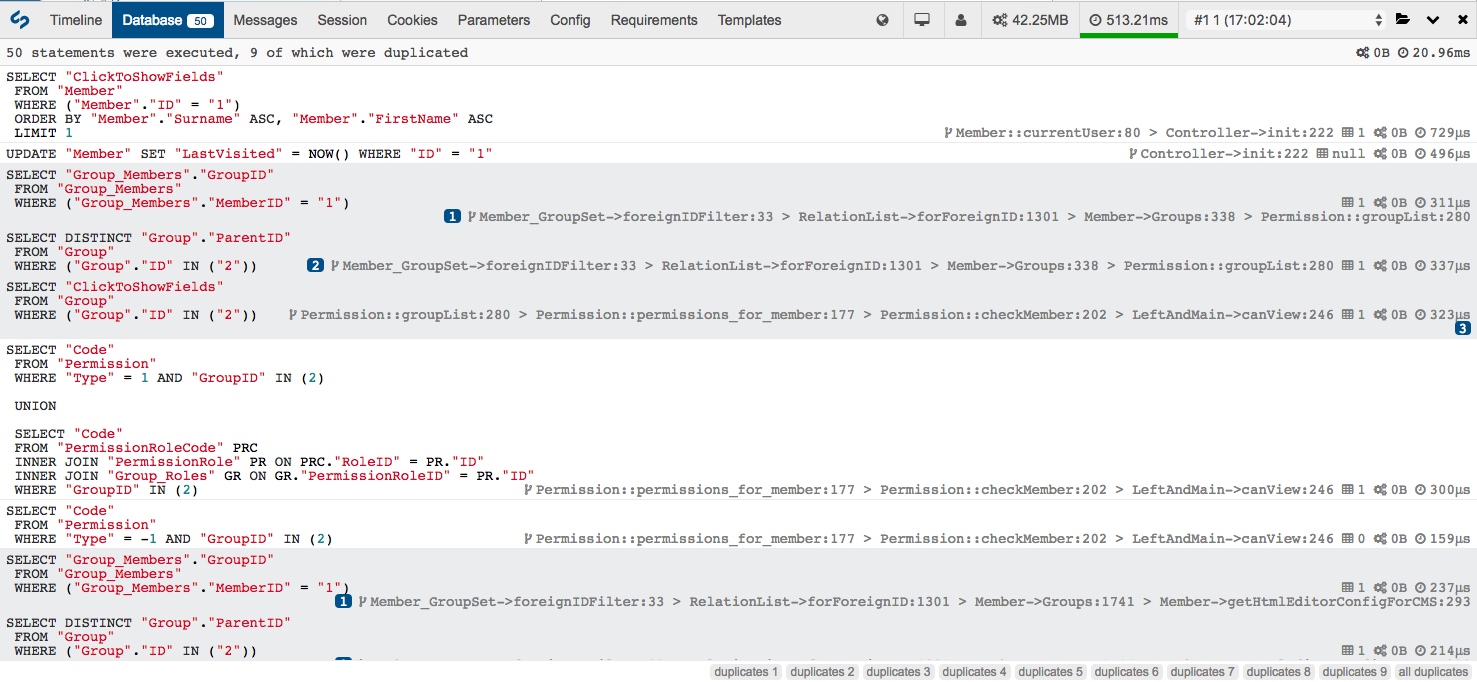
The "Database" tab allows you to view a list of all the database operations that a page request has made, and will group duplicated queries together. This can be useful to identify areas where performance can be improved, such as using DataObject::get_by_id() (which caches the result) instead of DataObject::get()->byID().
By clicking on one of the duplicate group badges in the bottom right corner, you can see groups of duplicated queries:
To help you in debugging and optimising your application, it is recommended to leave the find_source option on. This will help you to identify what triggers the query and where to implement caching appropriately.
If you are using ?showqueries=1, you will also see that the usage has been optimised to display all queries nicely and their result on the page.
Also remember that if you use the d() helper, any string variable with "sql" in the name will be formatted as a SQL string.
Long running queries
When some queries take a long time to run they will be highlighted in red, with the request time (right hand side per item) highlighted in bold red text. The threshold for this time can be adjusted by modifying the DebugBar.warn_dbqueries_threshold_seconds configuration setting.
Note: The above example has been adjusted to be deliberately short. The default threshold value is one second for a long running query.
Large numbers of queries
If a page request performance is more than a certain number of queries, a warning message will be sent to the "Messages" tab. You can adjust the threshold for this with the DebugBar.warn_query_limit configuration setting.
System logs and messages
The "Messages" tab will show you a list of anything that has been processed by a SilverStripe logger during a page execution:
You can filter the list by type by clicking on one of the log level buttons in the bottom right corner.
Note: At times, other DebugBar components may also send messages to this tab.
Template use
The "Templates" tab will show you how many template calls were made, and the file path relative to the project root directory for each.
This will only be populated when you are flushing your cache (?flush=1). When templates are cached, a notice will be displayed letting you know to flush to see the full list.
Partial caching hits and misses
The "TemplateCache" tab shows how effective your chosen partial cache key is (e.g. <% cached 'navigation', $LastEdited %>...<% end_cached %>). It does
this by indicating whether a key has hit a cache or not.
Environment and other information
There is a variety of other useful information available via various tabs and indicators on the debug bar. See the screenshot below, and the arrows explained in order from left to right:
Tabs
- Session: Displays a list of everything in your current SilverStripe session
- Cookies: Displays a list of all cookies available in a request
- Parameters: Displays all GET, POST and ROUTE parameters from the current request
- Config: Displays a list of the current SiteConfig settings from the CMS
- Requirements: Shows a list of all
Requirementscalls made during a page's execution - Middlewares: Shows a list of all
Middlewaresused for this request - Mails: Shows a list of all emails sent
- Headers: Shows a list of all headers
Indicators
Hover over indicators to see:
- Locale: The locale currently being used in the site
- Version: The current SilverStripe software version being used
- User: The name of the user currently logged in
- Memory usage: The amount of memory used to generate a page
- Request time: The total time to generate a page (see below)
Request time
The request time indicator shows you how long it took for the server to render a page, it doesn't include the time your browser takes to render it. You can use browser consoles to profile this aspect.
- For a regular page load, the request time will have a green underline to indicate a healthy speed
- For a slower page load, the request time will have an orange underline to indicate that it took longer than it perhaps should have, but is still OK
- For a long page load, the request time will have a red underline to indicate that it is potentially dangerously slow
The threshold for a dangerously slow page load can be configured with the DebugBar.warn_request_time_seconds configuration setting.
The threshold for a slower/warning level indicator is defined as a percentage of the dangerous threshold (by default, 50%). This can be adjusted by modifying the DebugBar.warn_warning_ratio configuration setting.
Helper methods
Quick debugging
The d() function helps you to quickly debug code. It will use the Symfony VarDumper to display the data in a "pretty" way.
In an XHR/AJAX context, it will simply display the data in a more simple fashion.
When d() is called without arguments, it will display all objects in the debug backtrace. It will display the variable name before its content to make it easy to identify data amongst multiple values.
d($myvar, $myothervar);
Any call to d() with "sql" in the name of the variable will output a properly formatted SQL query, for instance:
d($myDataList->sql());
Quick logging
The l() function helps you to log messages, and since they will appear in the "Messages" tab, it is very useful.
l('My message');
Configuration options
Wherever possible, features and settings have been made configurable. You can see a list of the default configuration settings by looking at _config/debugbar.yml. To modify any of these settings you can define a YAML configuration block in your mysite/_config folder, for example:
mysite/_config/debugbar.yml:
---
Name: mysitedebugbar
---
LeKoala\DebugBar\DebugBar:
  enabled_in_admin: false
  query_limit: 500
Settings
Disabling the debug bar
You can disable the debug bar with PHP or configuration:
putenv('DEBUGBAR_DISABLE=true');
LeKoala\DebugBar\DebugBar:
  disabled: true
Troubleshooting
Using Vagrant
If you are using Vagrant (or presumably Docker or other virtualisation) and the DebugBar
isn't showing up, make sure you have the check_local_ip config option set to false. This
is due to the way Vagrant and Virtualbox configure networking by default.
Managing jQuery
The DebugBar will include its own version of jQuery by default. It will only be disabled in the admin (which already use jQuery).
If you have added jQuery in your requirements the DebugBar will not load its own jQuery version (if the filename is jquery.js or jquery.min.js). You can also set the following configuration flag to false to prevent the DebugBar from including its own jQuery.
LeKoala\DebugBar\DebugBar:
  include_jquery: false
If you are including jQuery yourself, it is expected you include it in Page::init().
Below is an example of how to the jQuery which ships with the framework:
protected function init()
{
    parent::init();
    Requirements::javascript('framework/thirdparty/jquery/jquery.min.js');
}
When using the simple theme, you probably want to disable the jquery from the cdn.
protected function init()
{
    parent::init();
    Requirements::block("//code.jquery.com/jquery-3.3.1.min.js");
}
If you include jQuery during an action, you need to call DebugBar::suppressJquery();.
This will move all our scripts after your own, which should include Jquery first.
public function my_action()
{
    DebugBar::suppressJquery();
    Requirements::javascript("//code.jquery.com/jquery-3.3.1.min.js");
    Requirements::javascript("my.plugin.js");

    return $this;
}
FulltextSearchable support
It has been reported that the FulltextSearchable extension conflicts with the config_collector.
If you happen to have an issue (eg: your $SearchForm not being printed), please disable the config_collector.
A quick note about the Security Page
LeKoala\DebugBar\Extension\ControllerExtension will include for you all the required assets for DebugBar.
This is done using the onAfterInit extension hook, however on the Security controller the onAfterInit is called before your init()
method in the PageController.
Since you need to add jQuery before DebugBar this may be a problem, and therefore requirements will NOT be included on the Security controller.
If you want DebugBar to work on the Security controller, make sure to include all relevant requirements by calling DebugBar::includeRequirements(); after you include jQuery. When DebugBar is disabled this call will be ignored. Also note that any subsequent call to this method will be ignored as well.
Customize DebugBar css
Any customisation to the default css (as stored in "assets") should be made to css/custom.css. This file will be appended to the default css.
More than one body
If you more than one body tag, the middleware will fail to insert properly the required scripts. If that happens, you can use the placeholder in your page template. This is where the scripts will be inserted.
*903 upstream sent too big header
When using nginx you can run into this error. This is due to the proxy_buffer being to small to send all response headers.
The recommended config on official guide is:
location /index.php { fastcgi_buffer_size 32k; fastcgi_busy_buffers_size 64k; fastcgi_buffers 4 32k; ... }
You can tweak the settings like so (adjust the values depending on your needs):
location ~ .php$ { fastcgi_buffer_size 1024k; fastcgi_busy_buffers_size 2048k; fastcgi_buffers 4 1024k; ... }
Maintainer
LeKoala - thomas@lekoala.be
License
This module is licensed under the MIT license.


